 Click here to see table.
Social networkers frequently make use of drawings to communicate information and ideas about networks. However, the impact of the layout of a network on the conclusions that a viewer is likely to draw has so far received very little scrutiny. In this paper, we extend work begun in (Blythe et al, 1995) and (McGrath et al, 1996) to understand how the layout of graphs depicting social network data influences the inferences viewers draw about social networks. Our previous work focused on the perception of prominence or bridging of a particular node. Here we focus on perceptions of clustering among nodes.
Previous empirical work studying graph layout and social networks has shown that layout influences viewers' perception of the prominence, or importance of individuals in the network (Blythe et al, 1995). Purchase et al. (1995) report on experimental work validating general graph layout aesthetics. Both of these empirical studies of human perception of graphs build on earlier work on graph drawing aesthetics (see Battista et al. (1994) for a survey of this work). n
Finding groups in networks of people is an important part of social network analysis. According to Scott (1991):
One of the most enduring concerns of those working in social network analysis has been the attempt to discover the various `cliques' and cohesive sub-groups into which a network can be divided.
We extend experimental work testing viewers' understanding of graphs based on layout by using an interactive system that allows us to closely track the responses and response time of people answering questions about the graphs.
This paper reports results of a larger study of network perception in which sixty-one graduate students who had just completed a course in organizational theory emphasizing networks in organizations participated. Participants evaluated one of five different orderings of five layouts chosen at random. The layouts presented to the participants had nodes labeled with first names which differ with each layout.
Our test platform is a modified version of KrackPlot 3.0 (Krackhardt et al., 1994), a social network drawing package, which participants use to interactively assign nodes to groups. Participants were able to assign nodes to one of (at most) five different groups by clicking on a square to activate a group and then clicking on the nodes they believed to be in that group. Participants were able to change a node's group assignment by clicking on the node while a different group was activated. This system allows us to track the exact order of assignment of nodes to groups as well as the time spent assigning each individual node to a group.
We brought participants together in a computer lab as we demonstrated the program. Before they began the exercise we told them :
In the following exercise, you will practice finding groups when the social network is presented as a graph. After we do two warm-up exercises together, you will have a chance to identify groups for five different graphs that show communication patterns among people, that is, a line between two people means they talk often.
To ensure that they participants were comfortable with the system we led the participants through two exercises: one in finding a particular node and clicking on it and one in activating a group and then assigning nodes to that group. Before each of the five graphs appeared, the following message appeared on the screen.
In the next screen, you will be shown a graph and asked to divide its nodes into separate groups. Each time you click on a node, its shape and color will change. You can select the shape and color by selecting the appropriate node in the menu bar at the top of the screen. Please make use of different shapes and colors to divide the nodes into the groups that seem appropriate.
Since each node could belong to only one group, respondents assigned nodes to the group in which they fit ``best''.
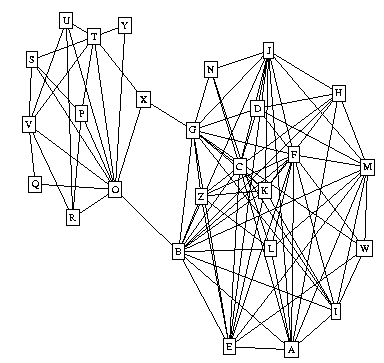 Layout 1
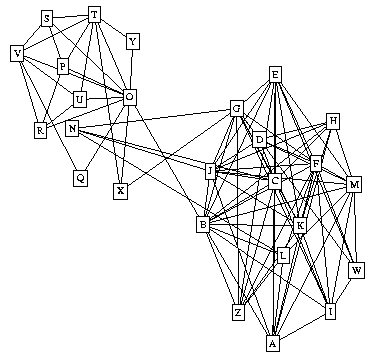 Layout 2
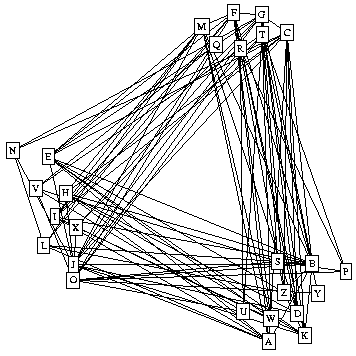 Layout 3
| Layout | N | Time (seconds) |
|---|---|---|
| (std dev) | ||
| Layout 1 | 31 | 72.5 |
| (32.48) | ||
| Layout 2 | 24 | 100.7 | (43.89) |
| Layout 3 | 33 | 132.8 |
| (98.54) |
Table 1 shows that on average viewers took the least amount of time assigning groups for Layout 1. The average amount of time for Layout 1 was 72.5 seconds. Viewers took 100.1 seconds on average to assign nodes for Layout 2 and 132.8 seconds on average to assign nodes for Layout 3. Of the three layouts of the interaction data, Layout 1 presents the information in a way that is most quickly understood by the viewers.
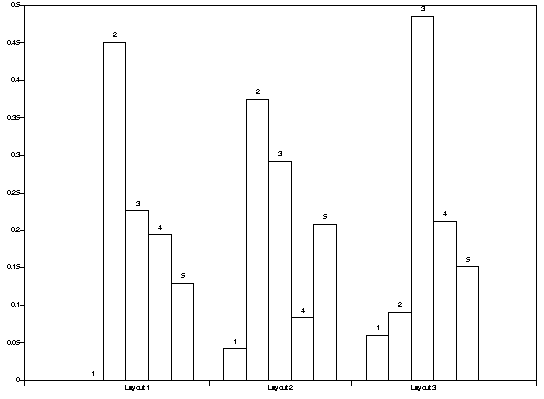
Figure 2 shows the proportion of viewers reporting one, two, three, four, or five groups, respectively. Forty-five percent of respondents who evaluated Layout 1 divided the nodes into two groups. Of those respondents evaluating Layout 2, 38% divided the nodes into two groups. For Layout 3 only 9% divided the nodes into two groups; instead 49% divided the nodes into three groups. This suggests that the spatial clustering of nodes, not simply the structure of the graph, is influencing respondents perceptions of the group structure. A chi-square test of independence supports the hypothesis that the number of groups reported by respondents is not independent of layout.
 Click here to see table.
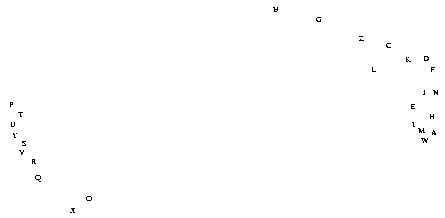 Layout 1
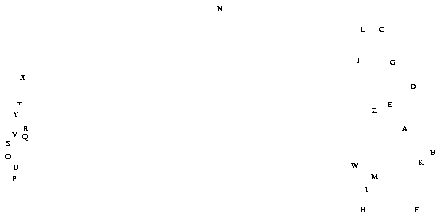 Layout 2
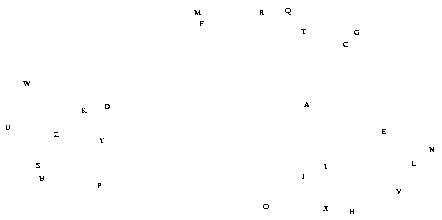 Layout 3
| Independent Variable | 1 | 2 | 3 | |
|---|---|---|---|---|
| Euclidean Distance/100 | -0.14 *** | -0.08 ** | -0.08 ** | |
| Adjacency Matrix | 0.26 *** | 0.10 | ||
| Path Distance | -0.28 *** | -0.24 *** | ||
| R^2 | 0.568 | 0.690 | 0.685 |
| Independent Variable | 1 | 2 | 3 | |
|---|---|---|---|---|
| Euclidean Distance/100 | -0.14 *** | -0.11 *** | -0.11 *** | |
| Adjacency Matrix | 0.23 *** | 0.02 | ||
| Path Distance | -0.19 *** | -0.18 *** | ||
| R^2 | 0.615 | 0.683 | 0.683 |
| Independent Variable | 1 | 2 | 3 | |
|---|---|---|---|---|
| Euclidean Distance/100 | -0.09 *** | -0.09 *** | -0.09 *** | |
| Adjacency Matrix | 0.04 * | 0.04 | ||
| Path Distance | -0.003 | -0.02 | ||
| R^2 | 0.767 | 0.767 | 0.764 |
| Adjacency | Path Dist | Euc Dist 1 | Euc Dist 2 | Euc Dist 3 | |
|---|---|---|---|---|---|
| A | X | -0.806 *** | -0.50 *** | -0.487 *** | 0.216 *** |
| P | X | 0.675 *** | 0.614 *** | -0.125 ** | |
| E1 | X | 0.810 *** | -0.091** | ||
| E2 | X | -0.068 * |
When the single node N is drawn in a cluster to which it has no links, its group membership is made unclear. Moreover, the consistency of reports of group membership decreases for the entire graph. In the first layout, nodes {B,G,X,O} are seen as bridging nodes. In the second layout, by moving N and allowing more line crossing, their role as bridges is lost. These preliminary results emphasise how fragile conclusions drawn from layouts of networks can be, and how important it can be to seek a clear depiction of a network.
One simple principle that must be followed to create a clear depiction of a network is clearly shown in this study: adjacent nodes must be placed near to each other if possible, and Euclidean distance should be correlated with path distance. This might be considered a ``First Principle'' in network layouts. Indeed, the third layout in our study produces results so different from the first two because it is in opposition to the first principle.
Blythe, J., C. McGrath, and D. Krackhardt. 1995. ``The Effect of Graph Layout on Inference from Social Network Data.'' In Symposium on Graph Drawing GD 95. Passau.
Di Battista, G., P. Eades, R. Tamassia, and I. Tollis. 1994. ``Algorithms for Drawing Graphs: an Annotated Bibliography.'' Computational Geometry: Theory and Applications.
Krackhardt, D., J. Blythe, and C. McGrath. 1994. ``KrackPlot 3.0: An Improved Network Drawing Program.'' Connections 17(2): 53--55.
McGrath, C., J. Blythe, and D. Krackhardt. forthcoming. ``The Effect of Spatial Arrangement on Judegments and Errors in Interpreting Graphs.'' Social Networks.
Purchase, H.C., R.F. Cohen, and M. James. 1995. ``Validating Graph Drawing Aesthetics.'' Symposium on Graph Drawing GD 95. Passau.
Scott, John. 1991. Social Network Analysis: A Handbook. Sage.